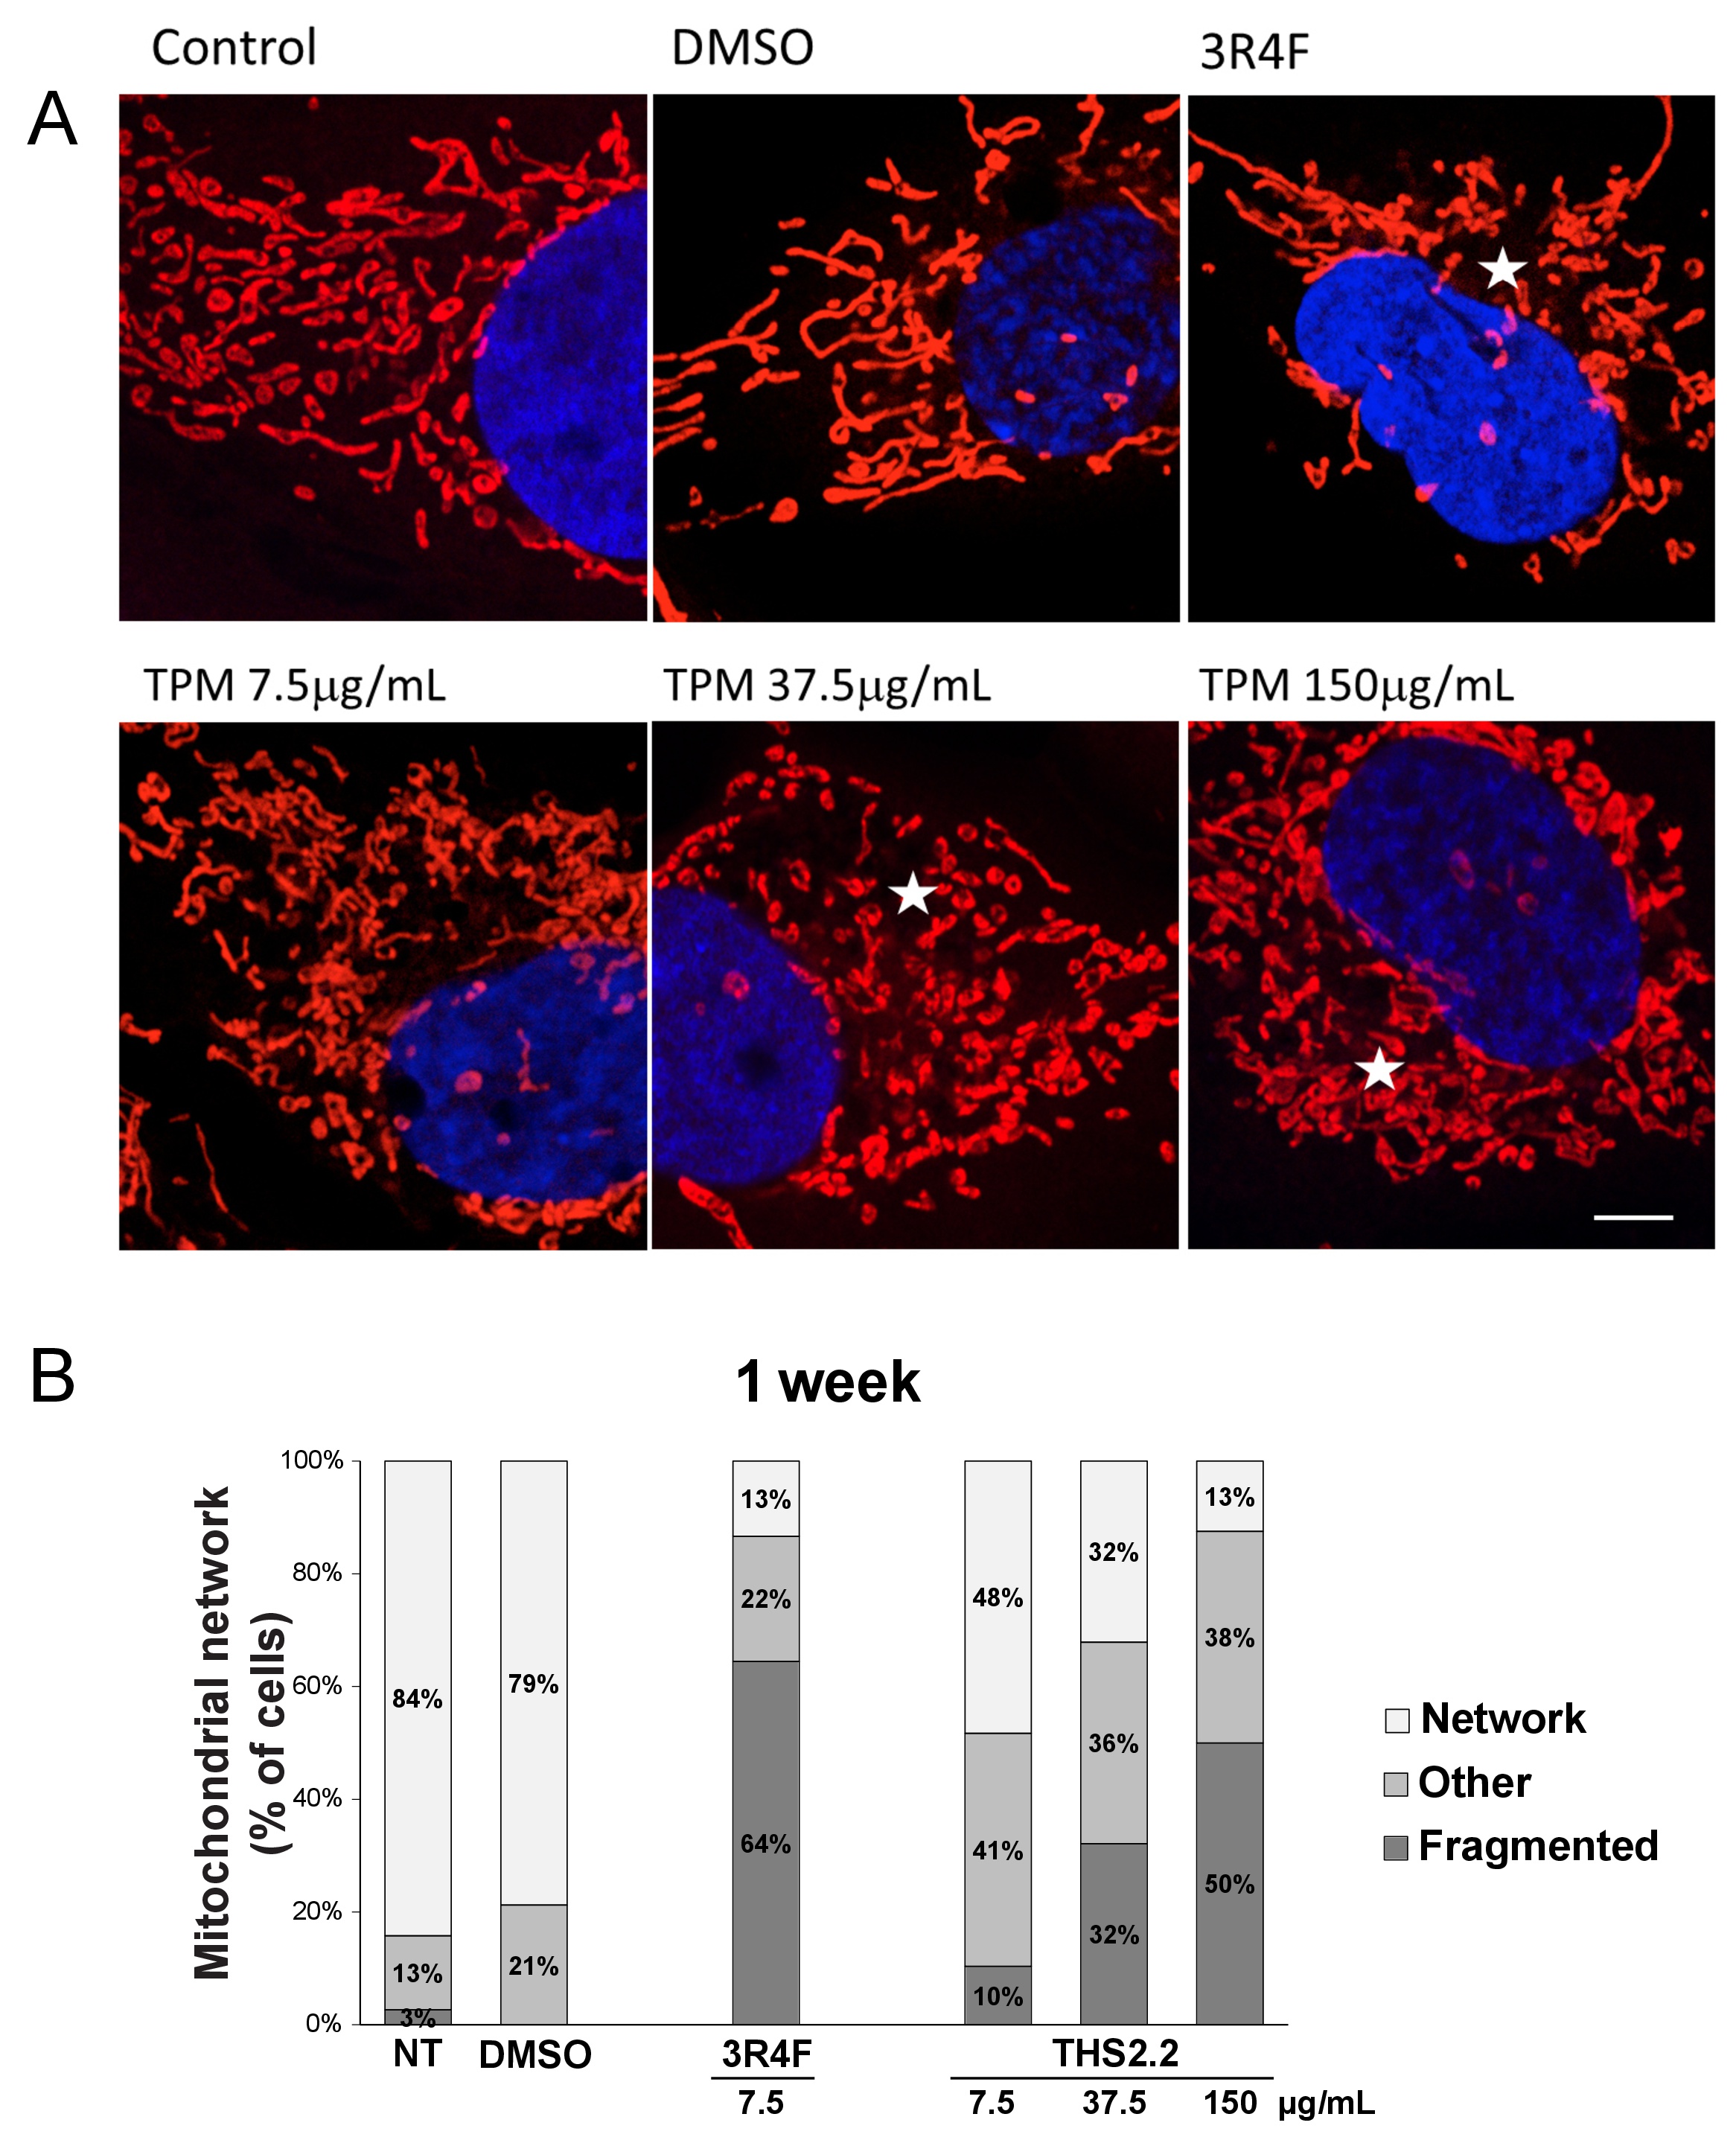
Fig. 4. Effects of a one-week exposure of BEAS-2B cells to TPM from 3R4F reference cigarette smoke (7.5 µg/mL) and THS 2.2 aerosol (7.5 µg/mL, 37.5 µg/mL, and 150 µg/mL) on mitochondrial network morphology. (A) Representative images of control (unexposed) cells and cells treated with DMSO, 7.5 µg/mL 3R4F reference cigarette smoke, and 7.5 µg/mL, 37.5 µg/mL, 150 µg/mL THS 2.2 aerosol TPM. Asterisks indicate for disrupted mitochondrial network (more separated from network and round mitochondria). Red, mitochondria; blue, nuclei. Scale bar represents 5 μm. (B) The graph shows quantitative changes in the morphology of the mitochondrial network.